Posted on December 4, 2015 by Christopher Masterjohn
An Enduring Mystery
ARTICLE SUMMARY
• In recent years, controversy has erupted over whether vitamin D2 or vitamin D3 is the predominant form of vitamin D in cod liver oil.
• Research in the 1930s suggested that there were at least four if not six forms of vitamin D in cod liver oil.
• Recent research has shown that fish metabolize vitamin D into at least three other compounds and probably more.
• Although cod liver oil probably does not contain vitamin D2, it probably does contain an array of different compounds derived from vitamin D3.
• The diverse array of vitamin D compounds we would expect to exist in natural cod liver oil likely provides a diverse array of biological activities; many people may experience vitamin D-related benefits from a natural cod liver oil without experiencing as pronounced a rise of 25(OH)D – the blood marker of vitamin D nutritional status—as they would have expected.
• Although it makes sense for someone to increase their sun exposure and vitamin D3 intake if their 25(OH)D is low, low 25(OH)D in and of itself should not be used as evidence that cod liver oil is not providing a vitamin D benefit.
In my 2006 article, “From Seafood to Sunshine: A New Understanding of Vitamin D Safety” (Wise Traditions, Fall 2006), I took the position that vitamin D primarily occurs in cod liver oil as vitamin D3. Nearly a decade later, there are reasons to revisit this question: first, several lab analyses of Green Pasture fermented cod liver oil have come to conflicting conclusions about whether the primary form of vitamin D therein is vitamin D2 or vitamin D3; second, modern research has begun to characterize the way in which fish metabolize vitamin D and has shown that fish contain several different vitamin D compounds. When taken together, the data provide hints that natural cod liver oil may contain a complex array of different vitamin D compounds. The exact nature of vitamin D in cod liver oil, however, remains a mystery in need of resolution.
NATURAL VITAMIN D IS COMPLEX
In an age of fortified foods and vitamin supplements, it is easy for us to overlook the natural complexity of the nutrition found in natural foods. In foods that are fortified with vitamin D, the vitamin D primarily exists in whatever form was added, whether vitamin D2 or vitamin D3. This is not true of natural exposure to vitamin D, whether that exposure comes from the sun or from natural foods.
When sunlight strikes our skin, it converts a close relative of cholesterol into vitamin D. At first, the vitamin D concentration within our skin begins to rise. As vitamin D accumulates, however, the sunlight begins to degrade it into a variety of other compounds. Although researchers generally consider these changes as “degradation” or “inactivation,” those other compounds are not without biological activity: several of them have been shown to prevent the excessive proliferation of skin cells and are thought to help prevent psoriasis.1
When we absorb vitamin D from sun exposure or from our diet, we metabolize it into a plethora of other compounds known as metabolites. The most well known of these is the two-step activation of vitamin D first to 25(OH)D or calcidiol and then to 1,25(OH)2D or calcitriol. These metabolites are also inactivated to 24,25(OH)2D and to 1,24,25(OH)3D. Each of these inactivated metabolites undergoes further metabolism to other compounds. In addition to this major inactivation pathway, there are also several other minor inactivation pathways. Moreover, many of these metabolites exist as stereoisomers, which can best be thought of as mirror images of one another at the level of their chemical structures.
While we often refer to these processes as “activation” or “inactivation,” this is an oversimplification: the changes of biological activity that occur at each step of metabolism are relative rather than absolute, and are often selective. For example, one study in infants found that between 6-18 percent of the circulating 25(OH)D was present as 3-epi-25(OH)D, a stereoisomer or mirror image of the ordinary form. Presumably, this is converted to 3-epi-1,25(OH)2D, which has been found in a variety of cells. When compared to the ordinary form of calcitriol, the 3-epi form has equal ability to suppress parathyroid hormone, a hormone that contributes to bone resorption, and to suppress the excessive proliferation of skin cells; however this form has less power to raise serum calcium levels.
Thus, the range of vitamin D metabolites within our bodies may carry a diverse array of different biological activities rather than each metabolite representing a gain or loss of a single type of biological activity.
Just as this vitamin D metabolism occurs within our own bodies, so it occurs in the animals whose meat, milk and eggs we eat for food. For example, there are at least five different vitamin D compounds present in natural milk, with the majority of vitamin D activity coming from 25(OH)D, not from vitamin D.2
THE “MULTIPLE NATURE OF VITAMIN D IN FISH OILS”
In “From Seafood to Sunshine,” I cited personal communication with Bruce Hollis for my statement that “only unconverted vitamin D is found in significant amounts in cod liver oil and most other vitamin D-rich foods.” To the best of my recollection from the phone conversation we had while I was writing that article, this was based on speculation about what seemed plausible rather than published data. I also recall from that time that one vitamin D researcher told me privately that I could probably make a lifetime career out of fully characterizing the nature of the vitamins present in natural cod liver oil. I have since encountered a number of reasons to believe the vitamin D in cod liver oil may represent a complex array of compounds.
Research on this topic dates back to the 1930s, much of which is published in the 1937 paper by Charles Bills and colleagues entitled “The Multiple Nature of the Vitamin D in Fish Oils.”3 Bills and his colleagues had shown early on that vitamins D2 and D3 were equally effective in rats but that chickens were unable to use vitamin D2. They then went on to characterize the chick-to-rat “efficacy ratio” of many different marine oils. The logic of the efficacy ratio was as follows: if the oil contained only D3, it would be equally effective in rats and chicks; if the oil was significantly more effective in one or the other species, this would suggest that some or all of its vitamin D activity came from another compound or several other compounds.
The Bills group implemented a number of experimental controls and analyzed a large enough series of oils to rule out the possibility that differences in efficacy resulted from vitamin D being bound to other substances, from synergism or antagonism between vitamins A and D, or from substances within the oil itself that could affect the bioavailability of vitamin D.
Early work in the Bills laboratory had suggested that cod liver oil was equally potent in rats and chickens. This would be consistent with the premise that cod liver oil contains only vitamin D3 and would be inconsistent with the premise that cod liver oil contains only vitamin D2. But these findings may also mean that cod liver oil contains a mix of vitamin D forms that happened to balance out between rats and chickens. In the 1937 paper, the Bills group analyzed the liver oils of three species of codfish: the pollack and two species of hake. They noted that “liver oils of the pollack and these particular hakes are legally cod liver oil” and that they “contribute materially to the ‘cod liver oil’ of certain localities.” The pollack liver oil was only half as effective in chickens than rats, while the hake liver oil was one-third more effective in chickens than rats.
Altogether, they analyzed the efficacy ratios of twenty-five different species and found considerable variation. They concluded that “two (or more than two) kinds of vitamin D exist in fish oils, the proportions varying in the different oils. It now seems unlikely that any particular fish oil, such as cod liver oil, contains one kind exclusively.”
Soon after this, Hickman and Gray, in collaboration with the Bills group,4 subjected cod liver oil to various temperatures to cause specific fractions of the oil to evaporate separately.5 They found that vitamin D activity evaporated into six different fractions, and concluded that cod liver oil contained two major forms of vitamin D and a total of at least four if not six different forms of vitamin D.
Hickman and Gray noted that they used Norwegian cod liver oil, which was “likely to contain more than one species of fish,” so they did not consider their investigation to yield conclusive information about the nature of vitamin D specifically in the species Gadus morhua, known commonly as Atlantic cod. “Nevertheless,” they wrote, “since a wide range of fractions was available from the distillation of many tons of the Norwegian oil, and since the oil continues to be a medicinal favorite, completion of the investigation seemed justified; it was borne in mind, however, that any complexity found in the vitamin D might arise from the mixture of species.”
While this possibility cannot be ignored, it seems quite unlikely that the Norwegian oil would contain liver oils from six different species, each with its own form of vitamin D. It seems far more likely that any one species would have a mix of different vitamin D forms, even if the proportion between those forms might vary from species to species.
At least as late as the 1960s, textbooks cited the Hickman and Gray experiment as showing that vitamins D2 and D3were the major forms of vitamin D in cod liver oil.6 Hickman and Gray never claimed this, however, because they never performed any analysis of the chemical structures of the vitamin fractions and therefore could not positively identify any of them. The Bills group had considered it “conceivable” but “not especially probable” that vitamin D2 was the component of some marine oils that led to a lower efficacy in chicks than in rats. To my knowledge, the work of Hickman and Gray was never followed up with a definitive identification of the four to six forms of vitamin D they suggested exist in cod liver oil.
MANY VITAMIN D METABOLITES EXIST IN FISH
Although less is known about the metabolism of fish than humans and other mammals, a 2010 review documented a number of studies showing the existence of 25(OH)D, 24,25(OH)2D, and 1,25(OH)2D in addition to vitamin D itself. In the Atlantic cod, about 10 percent of the total circulating vitamin D compounds exists as 24,25(OH)2D and about 13 percent exists as 25(OH)D; there are traces of 1,25(OH)2D and the remainder is vitamin D. Both the liver and kidney of Atlantic cod possess the enzyme that converts 25(OH)D to 1,25(OH)2D. Since the liver is a site of this conversion, one would expect that cod liver oil may contain both 25(OH)D and the fully active hormone, 1,25(OH)2D.
The authors of this review suggested that these metabolites were the “various kinds of vitamin D” that Bills and his colleagues had known existed in fish oils. Based on research in mammals, they also stressed that “for the understanding of the complexity of the vitamin D endocrine system, it is important to realize that many more metabolites of vitamin D3than described above may exist in fish and could be of physiological significance.”
DOES VITAMIN D2 EXIST IN COD LIVER OIL?
Scientific papers frequently state that although vitamin D2 is known to exist in large amounts in the diet of fish, it has never been found in the flesh or oil of fish. Various suggestions have been offered to explain this, such as the possibilities that fish do not absorb vitamin D2 from the diet or quickly clear it from their systems once absorbed.7 I have had difficulty locating published research documenting the lack of vitamin D2 in fish, but I have personally corresponded with several researchers who say they have often looked for it and never found it.
FIGURE 1. Diagram of an HPLC System
 The diagram depicts the basic features of an HPLC System. The pumps circulate the solvent, known as the mobile phase, through the entire system into the waste container. An injector moves a defined quantity of sample into the mobile phase and the mobile phase carries the sample into the column. Although not depicted, sample injection is typically automated by a computer-controlled autosampler. Separation of compounds within the sample takes place in the column. The mobile phase carries the separated sample compounds into the detector and then into the waste container. The detector sends information about the compounds to a computer, and the computer produces a chromatogram used to estimate the concentrations of the analytes of interest within the sample. See sidebar for a more detailed explanation. This diagram was originally published in Reference 9.
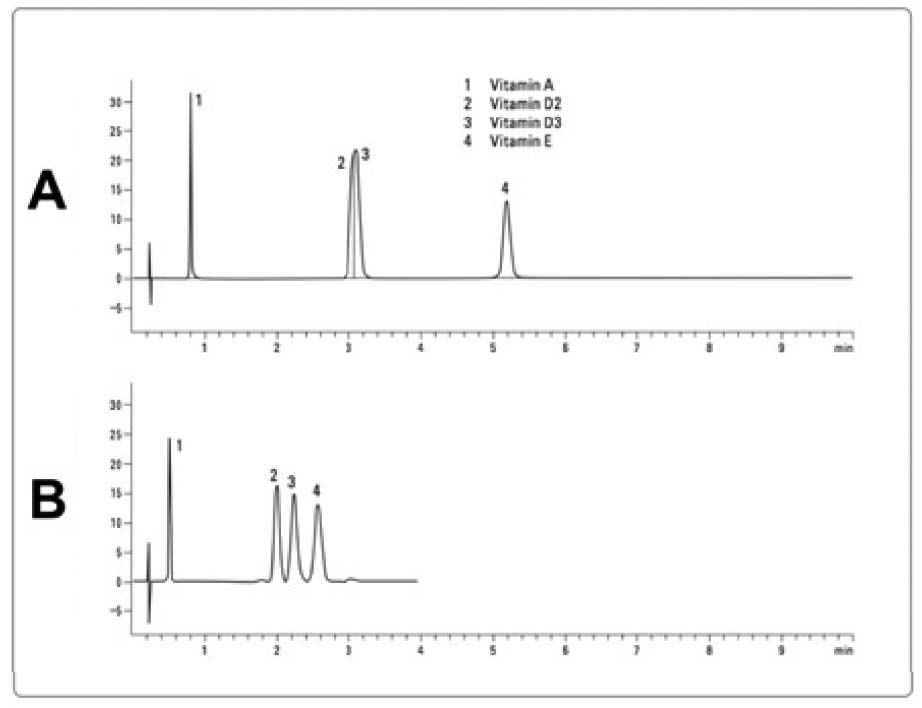 The figure is a slightly edited version of a figure that originally appeared in Reference 11. Both panels of the figure show examples of a chromatogram from an HPLC-UV method. The horizontal axis shows the time in minutes and the vertical axis shows the absorbance of UV light. As compounds that absorb light at the wavelength used elute from the column into the detector, the absorbance suddenly rises and then falls, forming the shape of a peak. The time at which the peak forms is an estimate of the time for which the compound (or compounds) it represents was (or were) retained in the column, and is called the retention time. Comparing panels A and B demonstrates the principle of coelution (see sidebar for a more detailed discussion). In panel A, four vitamins (A, D2, D3, and E) were injected but only three peaks are shown in the chromatogram. Since four peaks were expected, this provided strong evidence that two of the vitamins were coeluting with one another.
Although not shown, one could easily deduce which peaks represent which vitamins by injecting only one vitamin at a time and determining its retention time. Numbers have been added to the chromatogram to identify the peaks, and a vertical line has been drawn in the second peak to represent the fact that it reflects two compounds. In panel B, a different column was used that achieved separation between vitamins D2 and D3. Taken together, it is clear that the second peak of panel A is a case of coelution. Nevertheless, the chromatogram in and of itself gives no sign of this: the second peak looks perfectly formed and appears to represent only a single compound. Had this analysis been performed on a complex biological sample such as a natural food instead of a cocktail of four purified vitamins, it would have been much more difficult to determine that the analytes of interest were coeluting.
Vitamin D2 is often added to fish oils as an internal standard (a means of adjusting for loss of vitamin D during sample processing; see sidebar on page 57) when quantifying vitamin D3. Researchers who use vitamin D2 in this manner routinely look for naturally occurring vitamin D2 even if they do not publish the data, because if it exists their use of vitamin D2 as an internal standard would be invalid.
Given this, it was a surprise for two different labs to report that vitamin D2 is the main form of vitamin D in Green Pasture fermented cod liver oil. For a detailed analysis of this topic, see the sidebar on page 63. Readers who are not already familiar with high-performance liquid chromatography (HPLC) and the challenges of using it to measure vitamin D should start by first reading the sidebars on page 57 and 60 to obtain the necessary background information. The conclusion of the analysis in the sidebar on page 63 is that vitamin D2 is probably not present in the fermented cod liver oil.
It seems likely that all natural cod liver oils contain a mix of vitamin D metabolites. These may be exclusively metabolites of vitamin D3, but since the fate of the vitamin D2 known to be present in the diet of fish has not been definitively characterized, the possibility that vitamin D2 metabolites exist in the liver oil should not be ruled out entirely. Additionally, the fermented oil could contain other metabolites of vitamin D produced during the fermentation of the livers.
25(OH)D AS A MARKER OF COD LIVER OIL EFFICACY
In 2009, Green Pasture submitted fermented cod liver oil samples to Deltanoid Pharmaceuticals in Madison, Wisconsin for analysis of biological activity in rats. This analysis concluded that the oil had about 80 IU/mL of vitamin D activity based on the ability of the oil to support normal body weight and normal serum calcium levels.
It is likely that the average human response would be quantitatively different from the average rat response, just as the response from one rat to another or from one human to another would vary. It may also be the case that the oil would better support some biological endpoints than others when compared to other sources of vitamin D. Nevertheless, rats cannot absorb or utilize something from the oil that does not exist, so the rat studies definitively show that the oil is a potent source of one or more compounds responsible for biological vitamin D activity.
At the present time, blood levels of 25(OH) D are almost universally used as the exclusive marker of vitamin D nutritional status. Anecdotally, many people have reported that use of the fermented cod liver oil alone was unable to keep their 25(OH)D levels in the optimal range. It is important to realize that while vitamin D itself will raise 25(OH)D, some vitamin D metabolites would be expected to exert biological activity without raising 25(OH)D. For example, if the fully active 1,25(OH)2D is present in the oil, it will exert most of the biological effects of vitamin D but it will not raise 25(OH)D. In fact, it could even lower 25(OH)D by convincing the body that less 25(OH)D is needed and shunting it into an inactivation pathway.
I think it is wise to diversify one’s vitamin D intake between sun exposure and various dietary sources rather than relying on one product alone. However, I have also come to believe that 25(OH) D is being overused as a marker of vitamin D nutritional status and is being used in an overly simplistic manner. As I have been documenting in my “An Ancestral Perspective on Vitamin D Status” series on the Mother Nature Obeyed blog of westonaprice.org, several populations seem to be genetically adapted to a lower 25(OH)D level than American and European whites and there are many factors—some good, such as vitamin A; others bad, such as calcium deficiency or inflammation—that can lower 25(OH)D besides an inadequate intake of vitamin D.
AN ENDURING MYSTERY
The exact nature of vitamin D in cod liver oil remains to be fully elucidated. It is not a mystery in the sense that it cannot be resolved, but it endures as a mystery in the sense that much remains to be learned. I consider it likely that as we learn more, we will come to a greater and greater appreciation of the magnificent complexity contained within natural foods.
SIDEBARS
AN INTRODUCTION TO HIGH-PERFORMANCE LIQUID CHROMATOGRAPHY (HPLC)8.9
High-performance liquid chromatography (HPLC) is a means of separating individual compounds within a sample. Sometimes, the separation serves to isolate or concentrate a compound or a collection of compounds so that a scientist may use them for other purposes. This is called preparative HPLC. In this article, we are concerned only with HPLC that separates compounds for the purpose of measuring their concentrations within a sample, which is called analytical HPLC. In these cases, the compounds being analyzed are called analytes. In analyses aimed at quantifying the amount of vitamin D2 and vitamin D3 in a sample, we would say that vitamins D2 and D3 are the analytes of interest.
The basic setup of an HPLC system is shown in Figure 1. A pump or set of pumps moves a fluid called the mobile phase from its initial reservoir, typically a glass bottle, through the entire system and into a waste container. The person operating the system may have prepared the samples in any number of ways to make them more compatible with the method, and will have loaded them into the autosampler, a machine that automatically injects a defined quantity of sample into the mobile phase at specific time points determined by a computer program. Once the sample is injected, the mobile phase carries it to the column, where separation takes place. The separated analytes exit the column, one by one, into a detector. This process is called elution and the analytes are said to elute from the column. The detector then collects information that can be used to quantify the compounds and sends that information to a computer. Finally, the person operating the system uses a software application on the computer to analyze the information and thereby infer the concentration of the analytes in the sample.
While the fluid mobile phase carries the sample through the column, the column itself contains a solid bedding called the stationary phase. The principle of separation is competitive attraction between the mobile and stationary phases: all the compounds in the sample will have some level of attraction to the mobile phase and some level of attraction to the stationary phase; each particular compound, however, will have its own balance between these two attractions and will therefore pass through the column at its own rate. Thus, while the injected sample first arrives at the column as a single unit, the compounds that are most attracted to the mobile phase and least attracted to the stationary phase will elute from the column first, and the compounds with the opposite characteristics will elute last.
As the analytes elute from the column, they pass into the detector. There are a variety of detector types: some, for example, detect the ability of the analytes to absorb ultraviolet (UV) light, to absorb visible light, to fluoresce, or to undergo chemical reactions. The detector sends this information to a computer, and the computer software creates an image from it called a chromatogram (Figure 2). The chromatogram shows a series of peaks, each representing material that eluted from the column at a specific time point. That time is called the retention time because it reflects the amount of time for which the material that generated the peak had been retained in the column.
To quantify the analytes of interest in a sample, the magnitudes of their peaks (often measured as the peak area or height) are compared to those generated by known quantities of a standard. The standard can be external or internal. An external standard is a known quantity of the pure analyte of interest prepared in the same way and at the same time as the samples but injected separately into the HPLC system so that it generates its own chromatogram. An internal standard is a compound that is very similar to but distinct from the analyte of interest that is added to each sample at the beginning of the preparation step, injected into the system as part of each sample, and generates its own peak within the chromatogram of each sample. External standards help define how the size of the peaks relates to the concentration of the analyte of interest and help control for variation between batches in that relationship. Internal standards help control for loss of the analyte during sample processing. Depending on the relative need for these controls, a method may call for one, the other, or both.
Readers interested in learning more about chromatography should consult Reference 8, an essential text on the subject. General information on HPLC within this sidebar and throughout this article that is not associated with a specific citation is drawn from this reference as well as from my own laboratory experience.